Two lines in the SEO check light up at the same time. "Server response time (TTFB) 259 ms, should be under 200 ms." And right above it: "Largest Contentful Paint 1.4 s, very slow, visitors leave before the page becomes visible." Most people skim past it, because 1.4 seconds does not sound like much. That is exactly the mistake. On a web page, 1.4 seconds until something is visible is a small eternity, and 259 milliseconds before the server even starts to answer is an avoidable head start you hand to your competition. Both numbers measure different phases of the same process, and both can be improved on purpose.
What TTFB and LCP really measure
Picture a visitor clicking your link in the search results. What happens next runs in a fixed chain, and the two numbers mark two points on that chain.
TTFB stands for Time to First Byte. It measures how long your server takes to react to the browser's request at all. The browser asks, the server thinks, assembles the page, maybe queries the database, and then sends off the first piece of the answer. 259 milliseconds means a quarter of a second passes before anything comes back. During that time, the visitor still sees a blank page.
LCP stands for Largest Contentful Paint. It measures when the largest visible block on the screen has finished loading, usually the hero image, the main headline, or a large block of text. Only once that element is there does the visitor feel the page has arrived. An LCP of 1.4 seconds means one and a half seconds of waiting before the page feels usable.
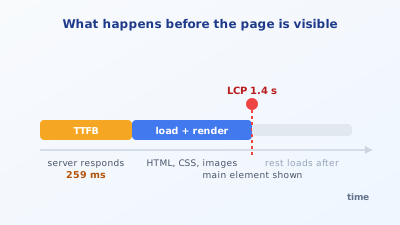
The crucial point: TTFB is part of LCP. Those 259 milliseconds of server time are already baked into the 1.4 seconds. If the server answers slowly, the prettiest optimisation of everything else cannot save it, because the clock is already running before the browser has a single byte. That is why every serious load-time effort starts at TTFB and works forward from there.
Why slow pages cost rankings and revenue
Speed is not a cosmetic detail. It works on two levels at once.
The first level is the user. With each additional second of load time, the bounce rate climbs noticeably. A visitor staring at a blank page does not wait patiently, they click back and take the next search result. On a phone, with shaky mobile coverage, patience is even shorter. Anyone running a shop sees it directly in revenue: slow product pages sell less, because a share of customers never start the purchase.
The second level is Google. Core Web Vitals, which LCP is part of, are an official ranking signal. In its documentation on page experience, Google has made clear that a page's speed and stability feed into the assessment. Between two pages of equal content, the faster one wins. And because Google sees the same fast bounce that the annoyed user triggers, the effect compounds: slow pages lose position, lose clicks as a result, and that in turn confirms Google's impression that the page is not the best answer.
There is also a technical side effect many overlook. A slow server slows the Googlebot too. If every page takes 259 milliseconds to respond, Google crawls fewer of your pages in the same time. On large sites that means new content is discovered and indexed later. So speed pays into not just rankings but how fast anything lands in the index at all.
Google's thresholds and why 1.4 seconds is still red
This is where it gets interesting, because two yardsticks contradict each other. Google itself only rates an LCP value as "needs improvement" from 2.5 seconds and "poor" from 4 seconds. By that official scale, 1.4 seconds would be green. So why does the check still raise the alarm?
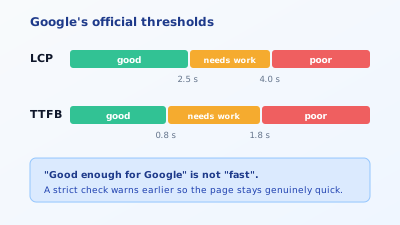
Because "good enough for Google" and "genuinely fast" are two different things. The official thresholds are a floor below which Google stops penalising you, not a target you should aim for. A genuinely fast page delivers the largest element in under a second, often under 500 milliseconds. Settle for 2.4 seconds because it is still in the green, and you leave on the table exactly the head start that makes the difference when the competition is level on content.
A strict check therefore warns earlier. It treats 1.4 seconds not as an error in the sense of "Google punishes you," but as a signal: there is room here, and the competition may already be using it. The same goes for TTFB. Google names roughly 0.8 seconds as a guide, but a well-configured server hits 100 to 200 milliseconds. 259 milliseconds is not a disaster, but it reveals that something in the hosting or caching is not optimal.
Try it yourself: The free SEO check at yourseo.app/analyse measures your page's LCP and TTFB live and puts the values in context, alongside ten other on-page fields. In under 30 seconds you see whether your load time is merely "okay" or genuinely fast.
Lowering TTFB: work on the server side
Because TTFB sits at the very start of the chain, it is the lever with the biggest impact. High values almost always have one of four causes.
The hosting is too weak. Cheap shared hosting packages split one server among hundreds of websites. At peak times it responds sluggishly. Moving to a better plan or a server with guaranteed resources is often the fastest win, without changing a line of code.
A cache is missing. If the server recomputes every request, querying the database and reassembling the page on each visit, that costs time. A server-side cache serves finished pages from memory instead of generating them every time. On a CMS like WordPress, a good caching plugin often halves TTFB right away.
The server is far away. If your server sits in the US but your visitors are in Germany, every request travels across the Atlantic and back. A content delivery network puts copies of your page on servers near your visitors and shortens that distance dramatically.
The database is slow. On dynamic pages with many queries, a single messy database query can push TTFB through the roof. This is the most demanding case, because it needs real profiling, but on shops with large catalogues it is often the decisive one.
Which cause applies to you can be narrowed down by loading the same page several times. If TTFB drops sharply on the second load, a cache is missing. If it stays consistently high, it is more likely the hosting or the distance.
A real example shows how big the lever is. An office-supply shop had a TTFB of around 700 milliseconds on its product pages, measured several times at different times of day. The images were already compressed, the theme lean, yet the page loaded slowly. The reason ran deeper: the caching plugin was installed but disabled entirely for logged-in sessions, and through a configuration error every visitor counted as logged in. After half an hour of fixing it, TTFB sat at 130 milliseconds and LCP fell from 2.1 to 0.9 seconds. Not a single image was touched. That is exactly what "measure first, then act" means: the visible cause was not the real one.
Improving LCP: work on the render side
If the server answers fast but LCP stays high, the problem lives in the browser, in loading and displaying. Here are the most common brakes.
The largest element is a huge image. On most pages the LCP element is an image, often the hero image at the top. If that image is two megabytes and in the wrong format, loading drags. The fix: a modern format like WebP, the right size instead of an oversized original, and loading the most important image with priority instead of kicking it off late like all the others. How to set images up cleanly overall, from format to alt text, belongs to the basics of every page anyway.
Render-blocking files stand in the way. Before the browser draws anything, it has to load certain CSS and JavaScript files. If those sit awkwardly or are too large, the browser waits even though the server answered long ago. Inlining critical CSS directly into the page and moving unimportant JavaScript to the end or loading it deferred helps noticeably here.
Fonts block the text. If the browser waits for a font before showing the text, the page stays blank longer. Loading the font with font-display: swap and serving it locally instead of from a third-party server speeds up the build and, as a bonus, avoids a privacy problem.
Lazy loading in the wrong place. Lazy loading, the deferred loading of images, is useful but fatal when applied to the LCP element. Lazy-loading the hero image tells the browser "load the most important element last." Lazy loading belongs under the images that only become visible on scroll, never on the topmost one.
Google bundles these levers in its own guide to Core Web Vitals and describes the order similarly: first the server response, then loading the resources, then rendering. Work in that order and you waste no time in the wrong place.
Common mistakes when optimising load time
Three patterns show up again and again, and all three cost time without delivering.
The first is optimising at the wrong end. Someone compresses images for weeks while the actual bottleneck is a TTFB of 800 milliseconds. The images were never the problem. Always measure first where the time is lost, then act.
The second is the plugin pile. On WordPress, many install three different performance plugins at once, which get in each other's way and end up loading more code than they save. One good caching plugin, configured cleanly, beats three set up half-heartedly.
The third is trusting a single test run. Load times fluctuate by time of day, server load, and measurement point. Testing a page once and taking the result at face value is misleading. More reliable is real field data from Search Console, showing how fast the page loads for actual visitors. How to read that data properly is covered in the post on reading Search Console data. And before chasing individual values, it is worth looking at the whole picture through a full on-page check, which assesses load time alongside the other fields.
Quick FAQ
Is LCP more important than TTFB? They are connected. TTFB is part of LCP, so a low TTFB automatically brings a better LCP. If both are red, start with TTFB, because that is the cause further up the chain.
My tool shows green, this check shows red. Who is right? Both, with different yardsticks. Google's official threshold for green is 2.5 seconds LCP, a strict check warns at 1.4 seconds already, because that is slower than technically necessary. Green means "not penalised," not "optimal."
How fast should a page realistically load? A TTFB under 200 milliseconds and an LCP under one second are achievable targets for most pages. Anything below that is excellent, anything well above leaves a head start on the table.
Does a CDN always help? If your visitors are geographically spread out or far from the server, yes, significantly. If server and visitors sit in the same region, the effect is smaller, but rarely harmful.
How long until an improvement affects rankings? The field data in Search Console takes a few weeks, because it is averaged over a rolling period. The effect on bounce rate, by contrast, you often see immediately.
At a glance
TTFB and LCP measure two points of the same loading chain, and TTFB is part of LCP. 259 milliseconds of server time and 1.4 seconds to visible content are not catastrophic, but they give away a head start the competition uses. Speed up the server first, then unburden the most important resources, then load the largest element with priority, and you get the most out of it. Google's green threshold is the floor, not the goal. Being genuinely fast pays into rankings, crawling, and revenue all at once. Speed is one of many building blocks that together make up your visibility on Google.